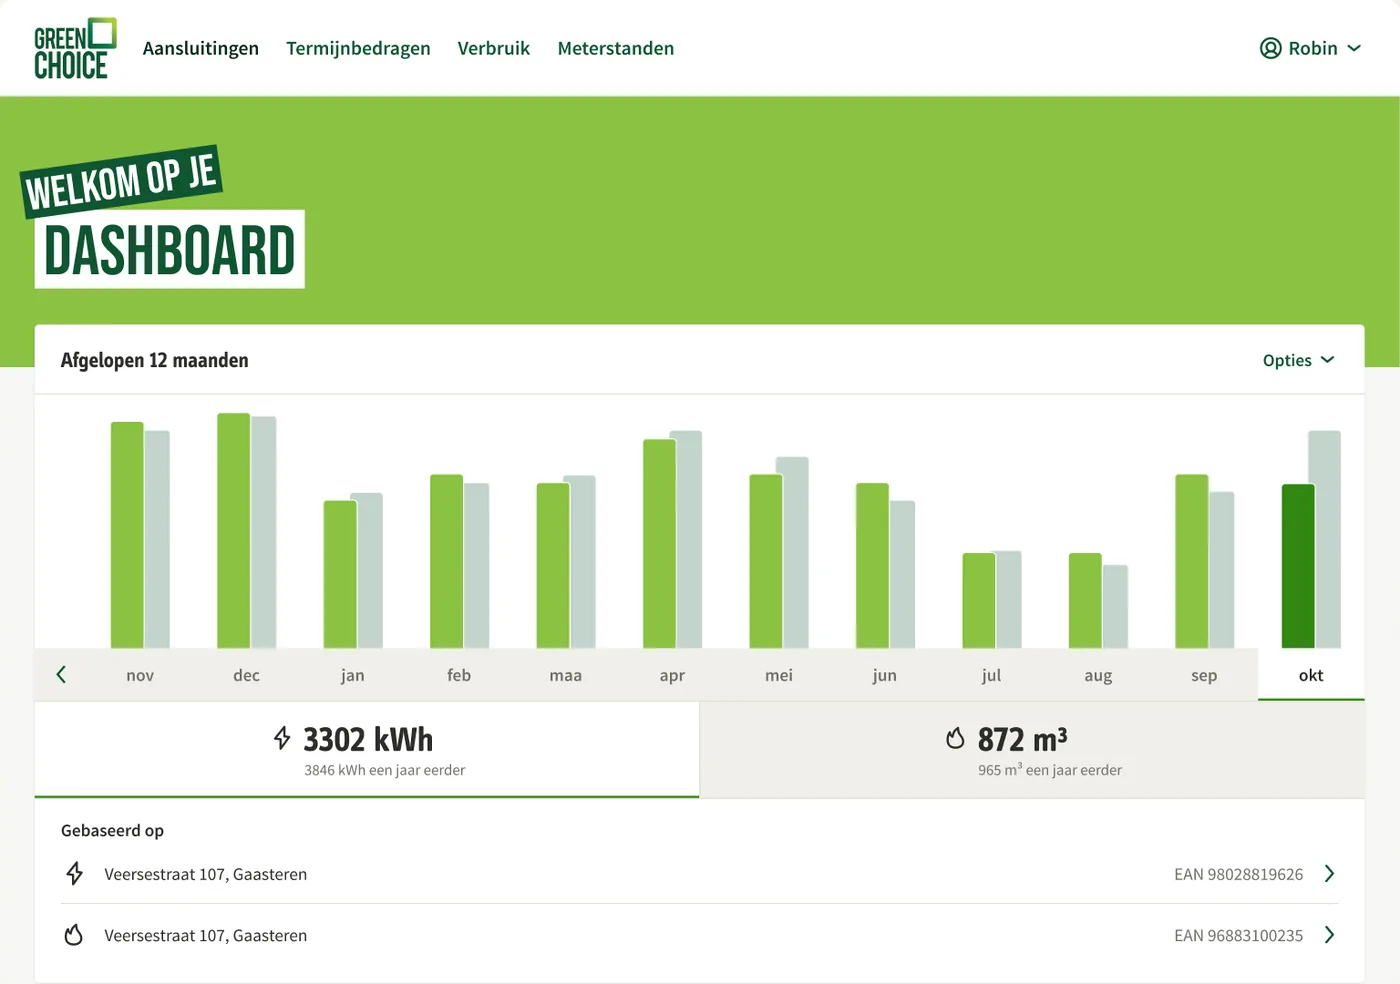
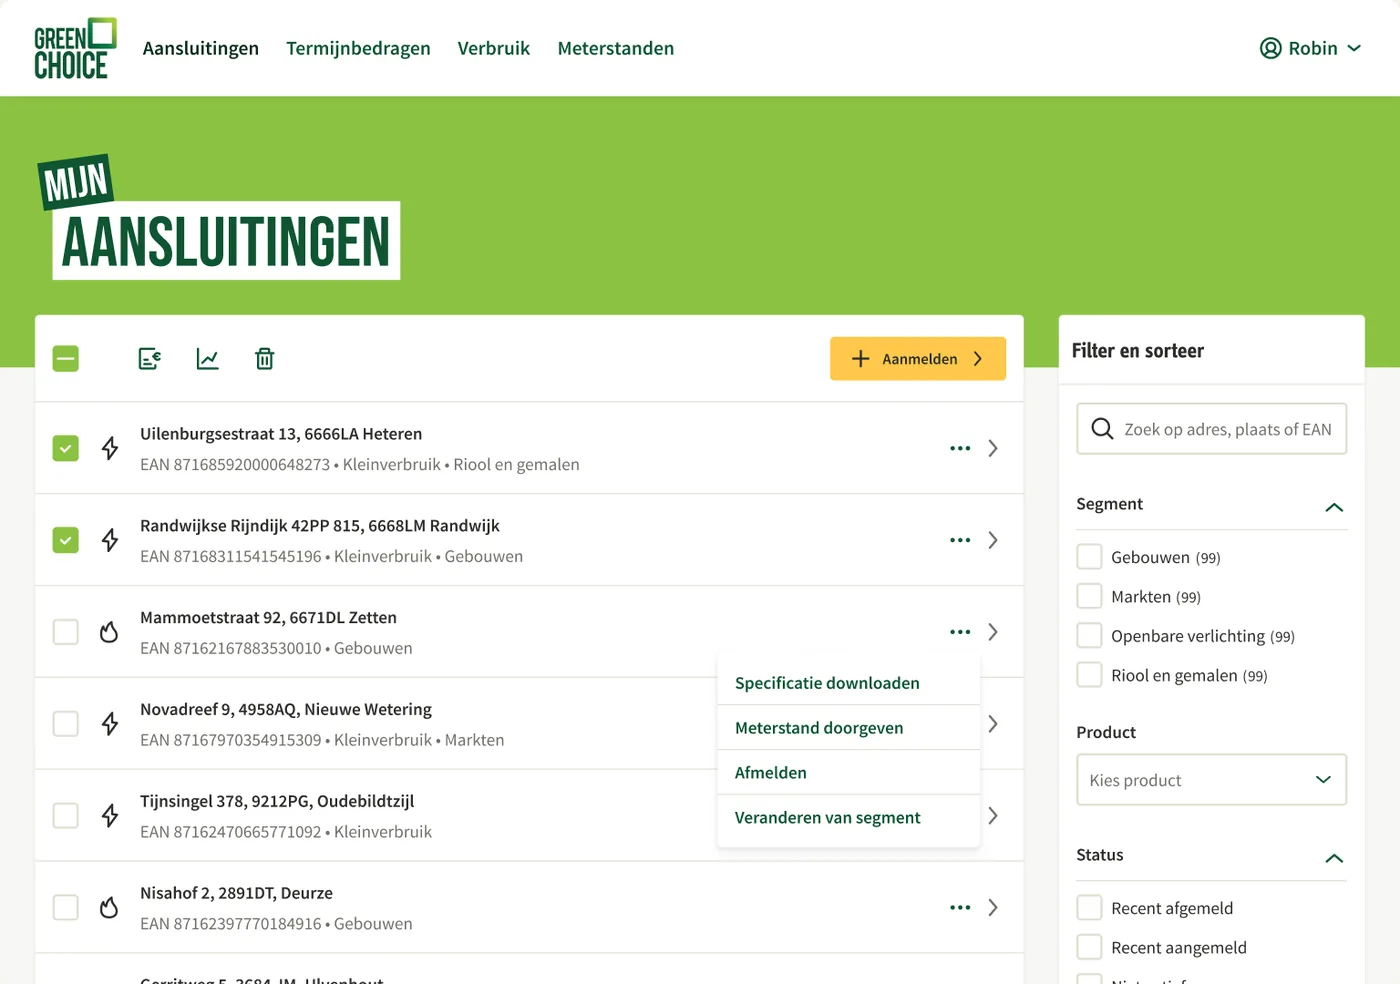
A baker with one building, a plumbing firm with five branches and a municipality with hundreds of street lights all log in to the same portal, with very different questions. The baker mostly wants to know whether their usage fits what they pay each month. The municipality wants a grip on hundreds of connections. What if the portal recognised who was logging in, and showed what fits that customer?
A portal full of connection codes
My brief was to bring Mijn Greenchoice Zakelijk up to the level of the consumer side, and closer to Greenchoice’s mission.
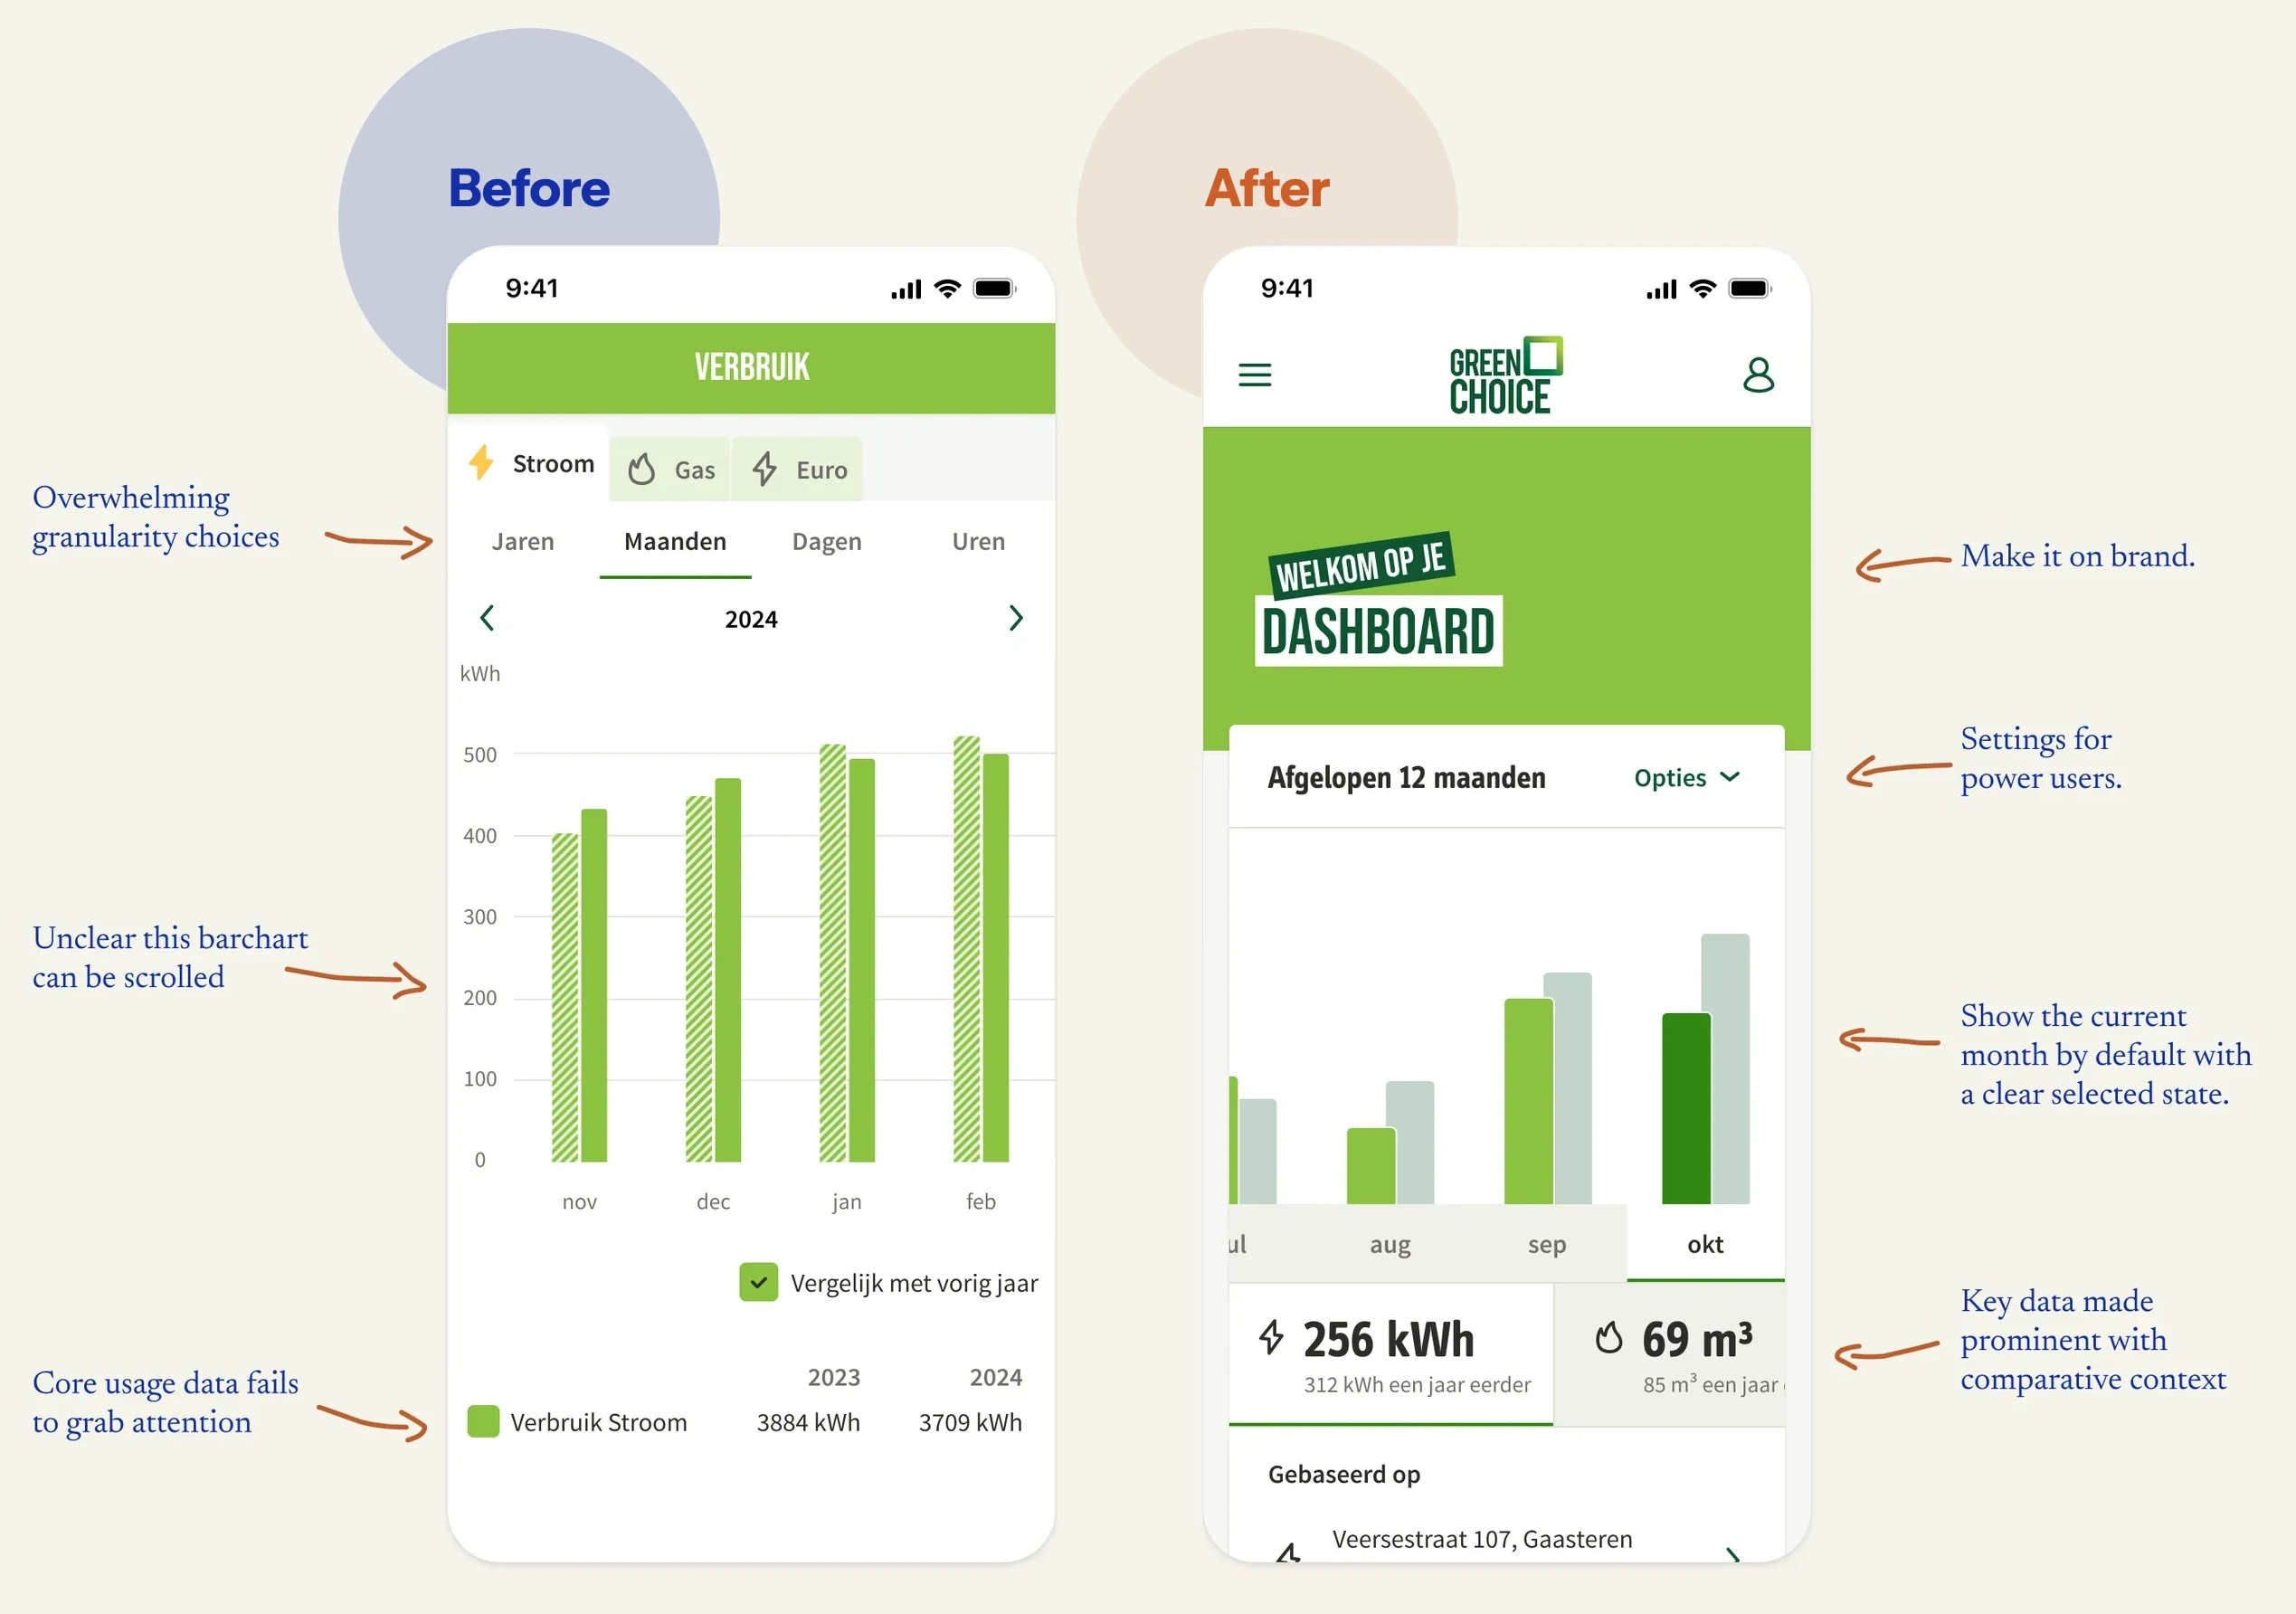
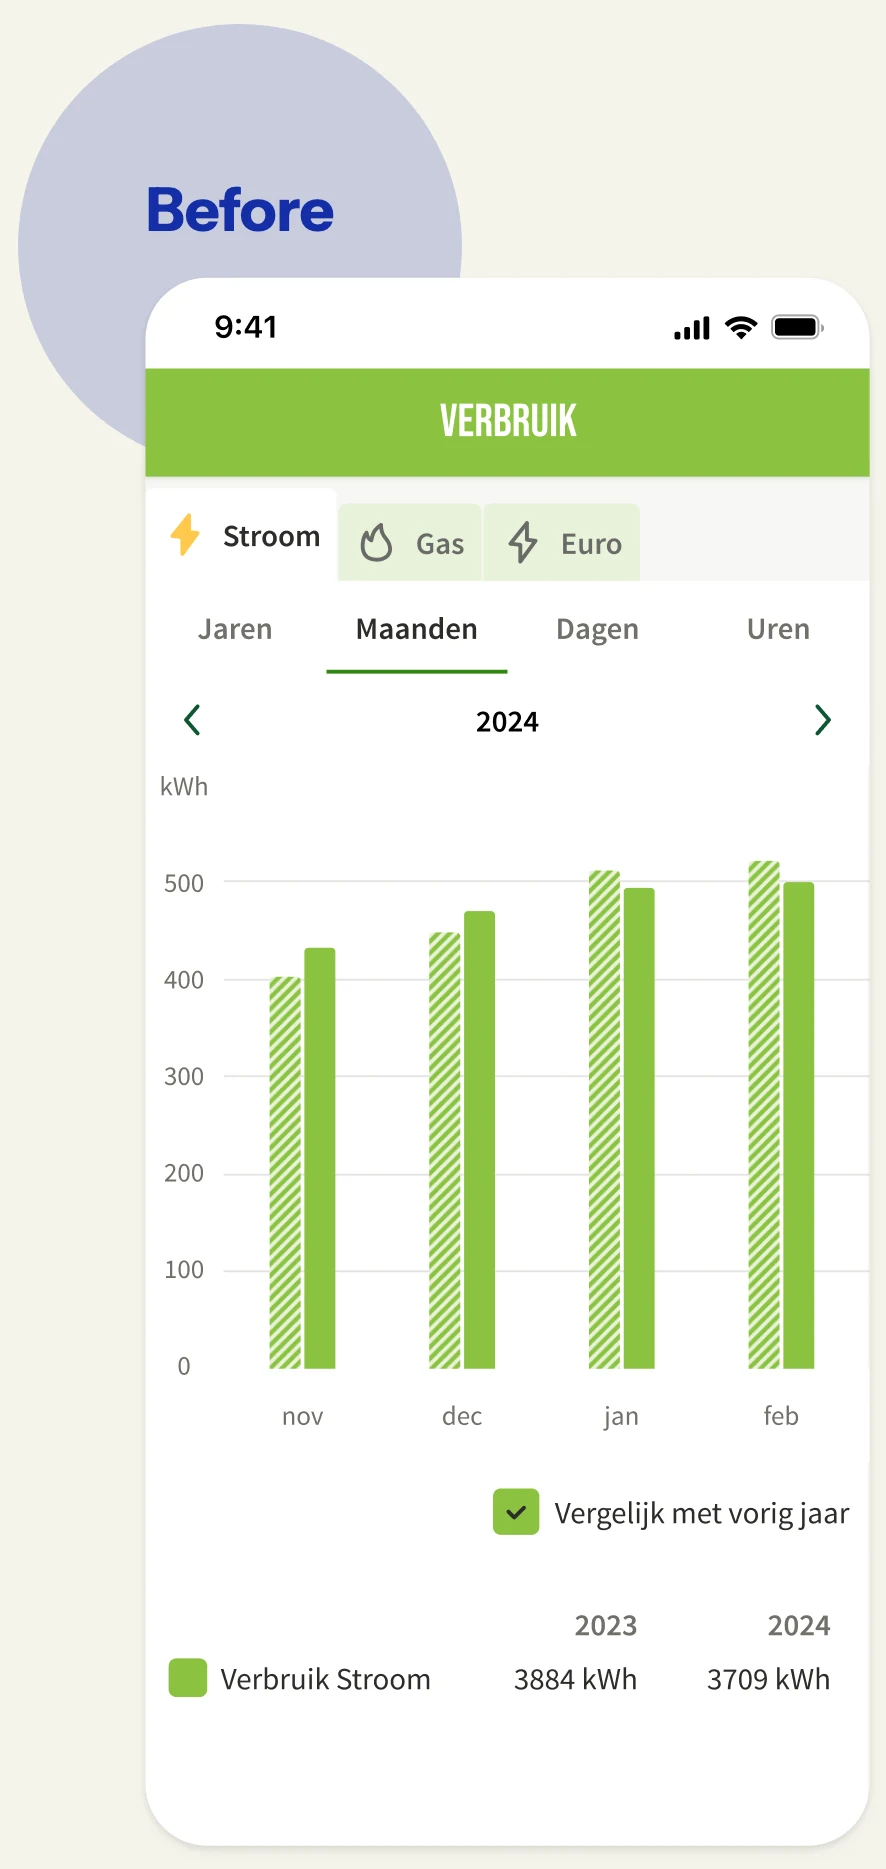
I started simply: rebuilding the existing portal in Figma with components from the design system. That’s how I got to know the product. What I saw was a portal that followed the implementation model: the interface mirrored the database. Connections, contracts, monthly instalments, invoices, changes, usage and meter readings each had their own page. And the usage chart had so many settings that I wondered who actually used them all; most users simply go with whatever you show them by default.
Who was this portal really set up for? I went digging and found that most business customers had only one building. So the portal had been built around organisations with hundreds of connections, a small minority. And even they got little out of long lists of codes, any more than SMEs did. Meanwhile many business owners turned to customer service for something as simple as changing their monthly instalment.
Customers don’t think in EANs
An EAN is an eighteen-digit code that identifies a connection. For an energy supplier, that’s the logical unit. Customers just don’t think in codes. They think of their shop, their workshop or the charging point in the car park. Or, if you’re a municipality, of street lights, pumping stations and swimming pools. So what a customer needs depends on their situation.
A number without context means nothing
For most people, kWh and m³ are abstract concepts; a number without a point of reference means nothing. To work out what context a customer needs, I wanted to know why they open the chart. I drew up two jobs-to-be-done as assumptions, which stakeholders and customer service then confirmed.
- A customer checking their usage wants to see whether it fits their monthly instalment, so they feel in control of their energy costs.
- A customer wants to see where they can save energy or make their business more sustainable.
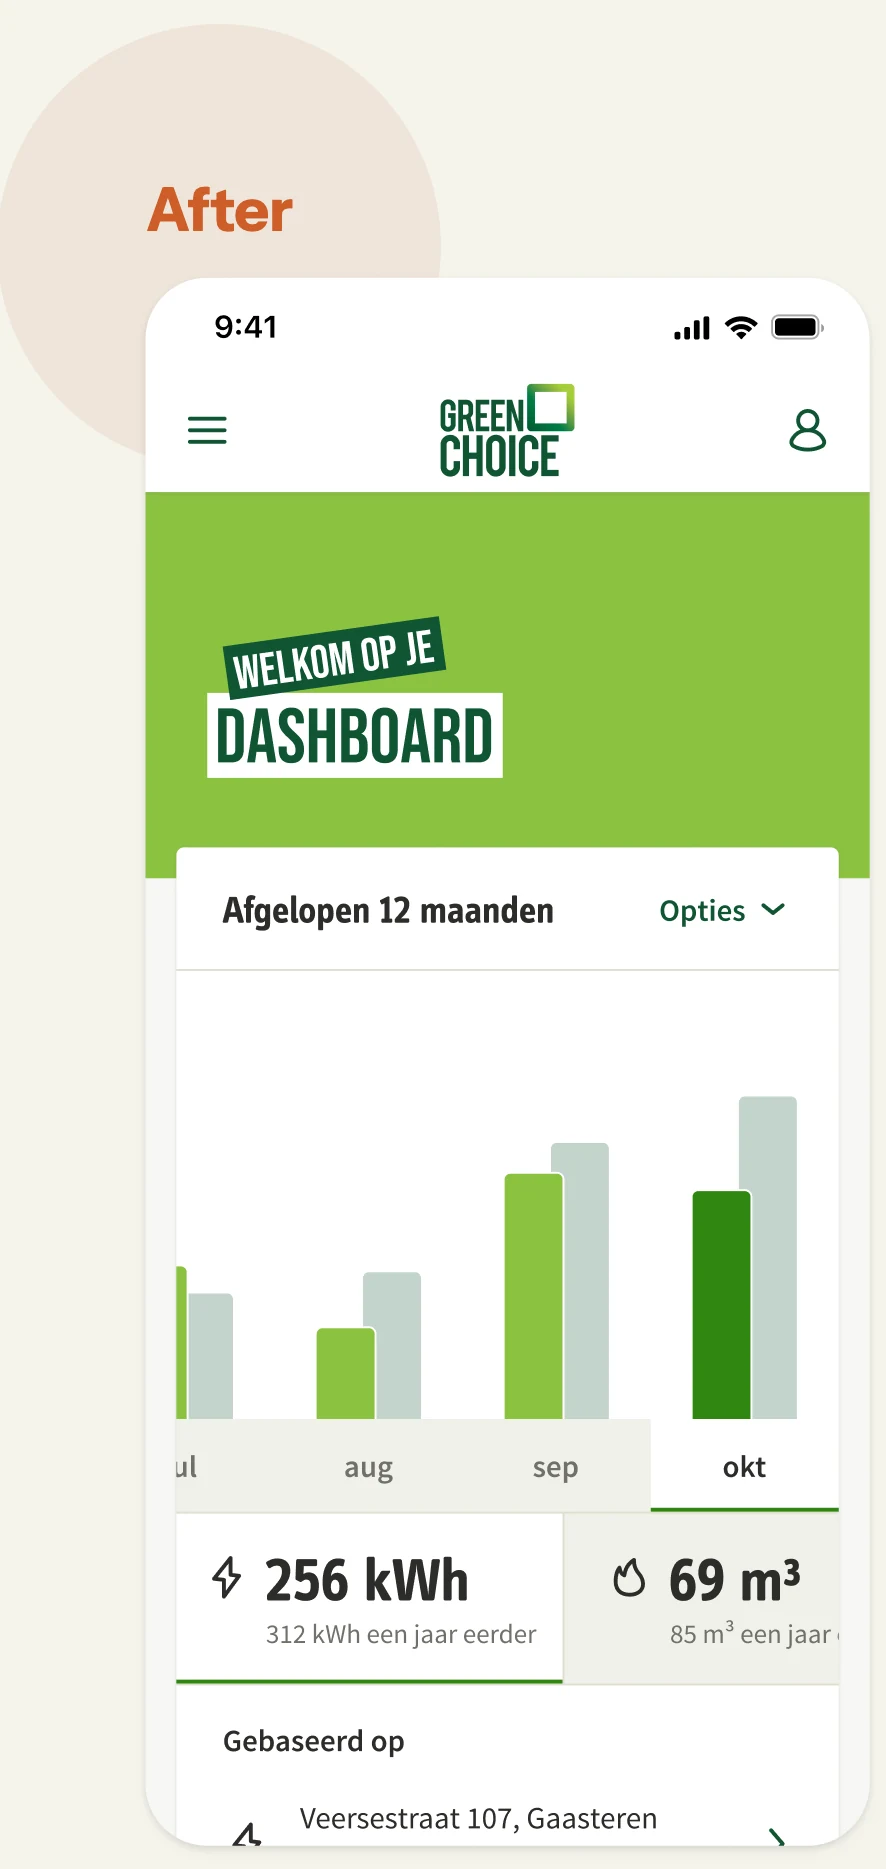
I focused the chart on those: a strong default that answers those questions straight away, with the context alongside. The real data nerds can still go wild in the options. I designed the chart as a module in the design system, so it can come back anywhere in the organisation and adapt to the situation it’s used in.
Attached to what you know
A new chart is quickly designed, but do people actually understand it? I tested with nine customers, who went through two prototypes: the current chart and my new design. Most of them looked at their usage daily or weekly.
While going through the new design, many of the participants pushed back. At first I thought the new design had done badly in the test. Until I dug into the analysis. It turned out that across the board the new design was more effective: people completed the task faster and were better able to explain what the interface was trying to tell them. It reminded me of status quo bias. So my conclusion was to go ahead with the new design, but to roll out the change in small steps. That way people get used to new things bit by bit, and you avoid the pushback.
What, how and why
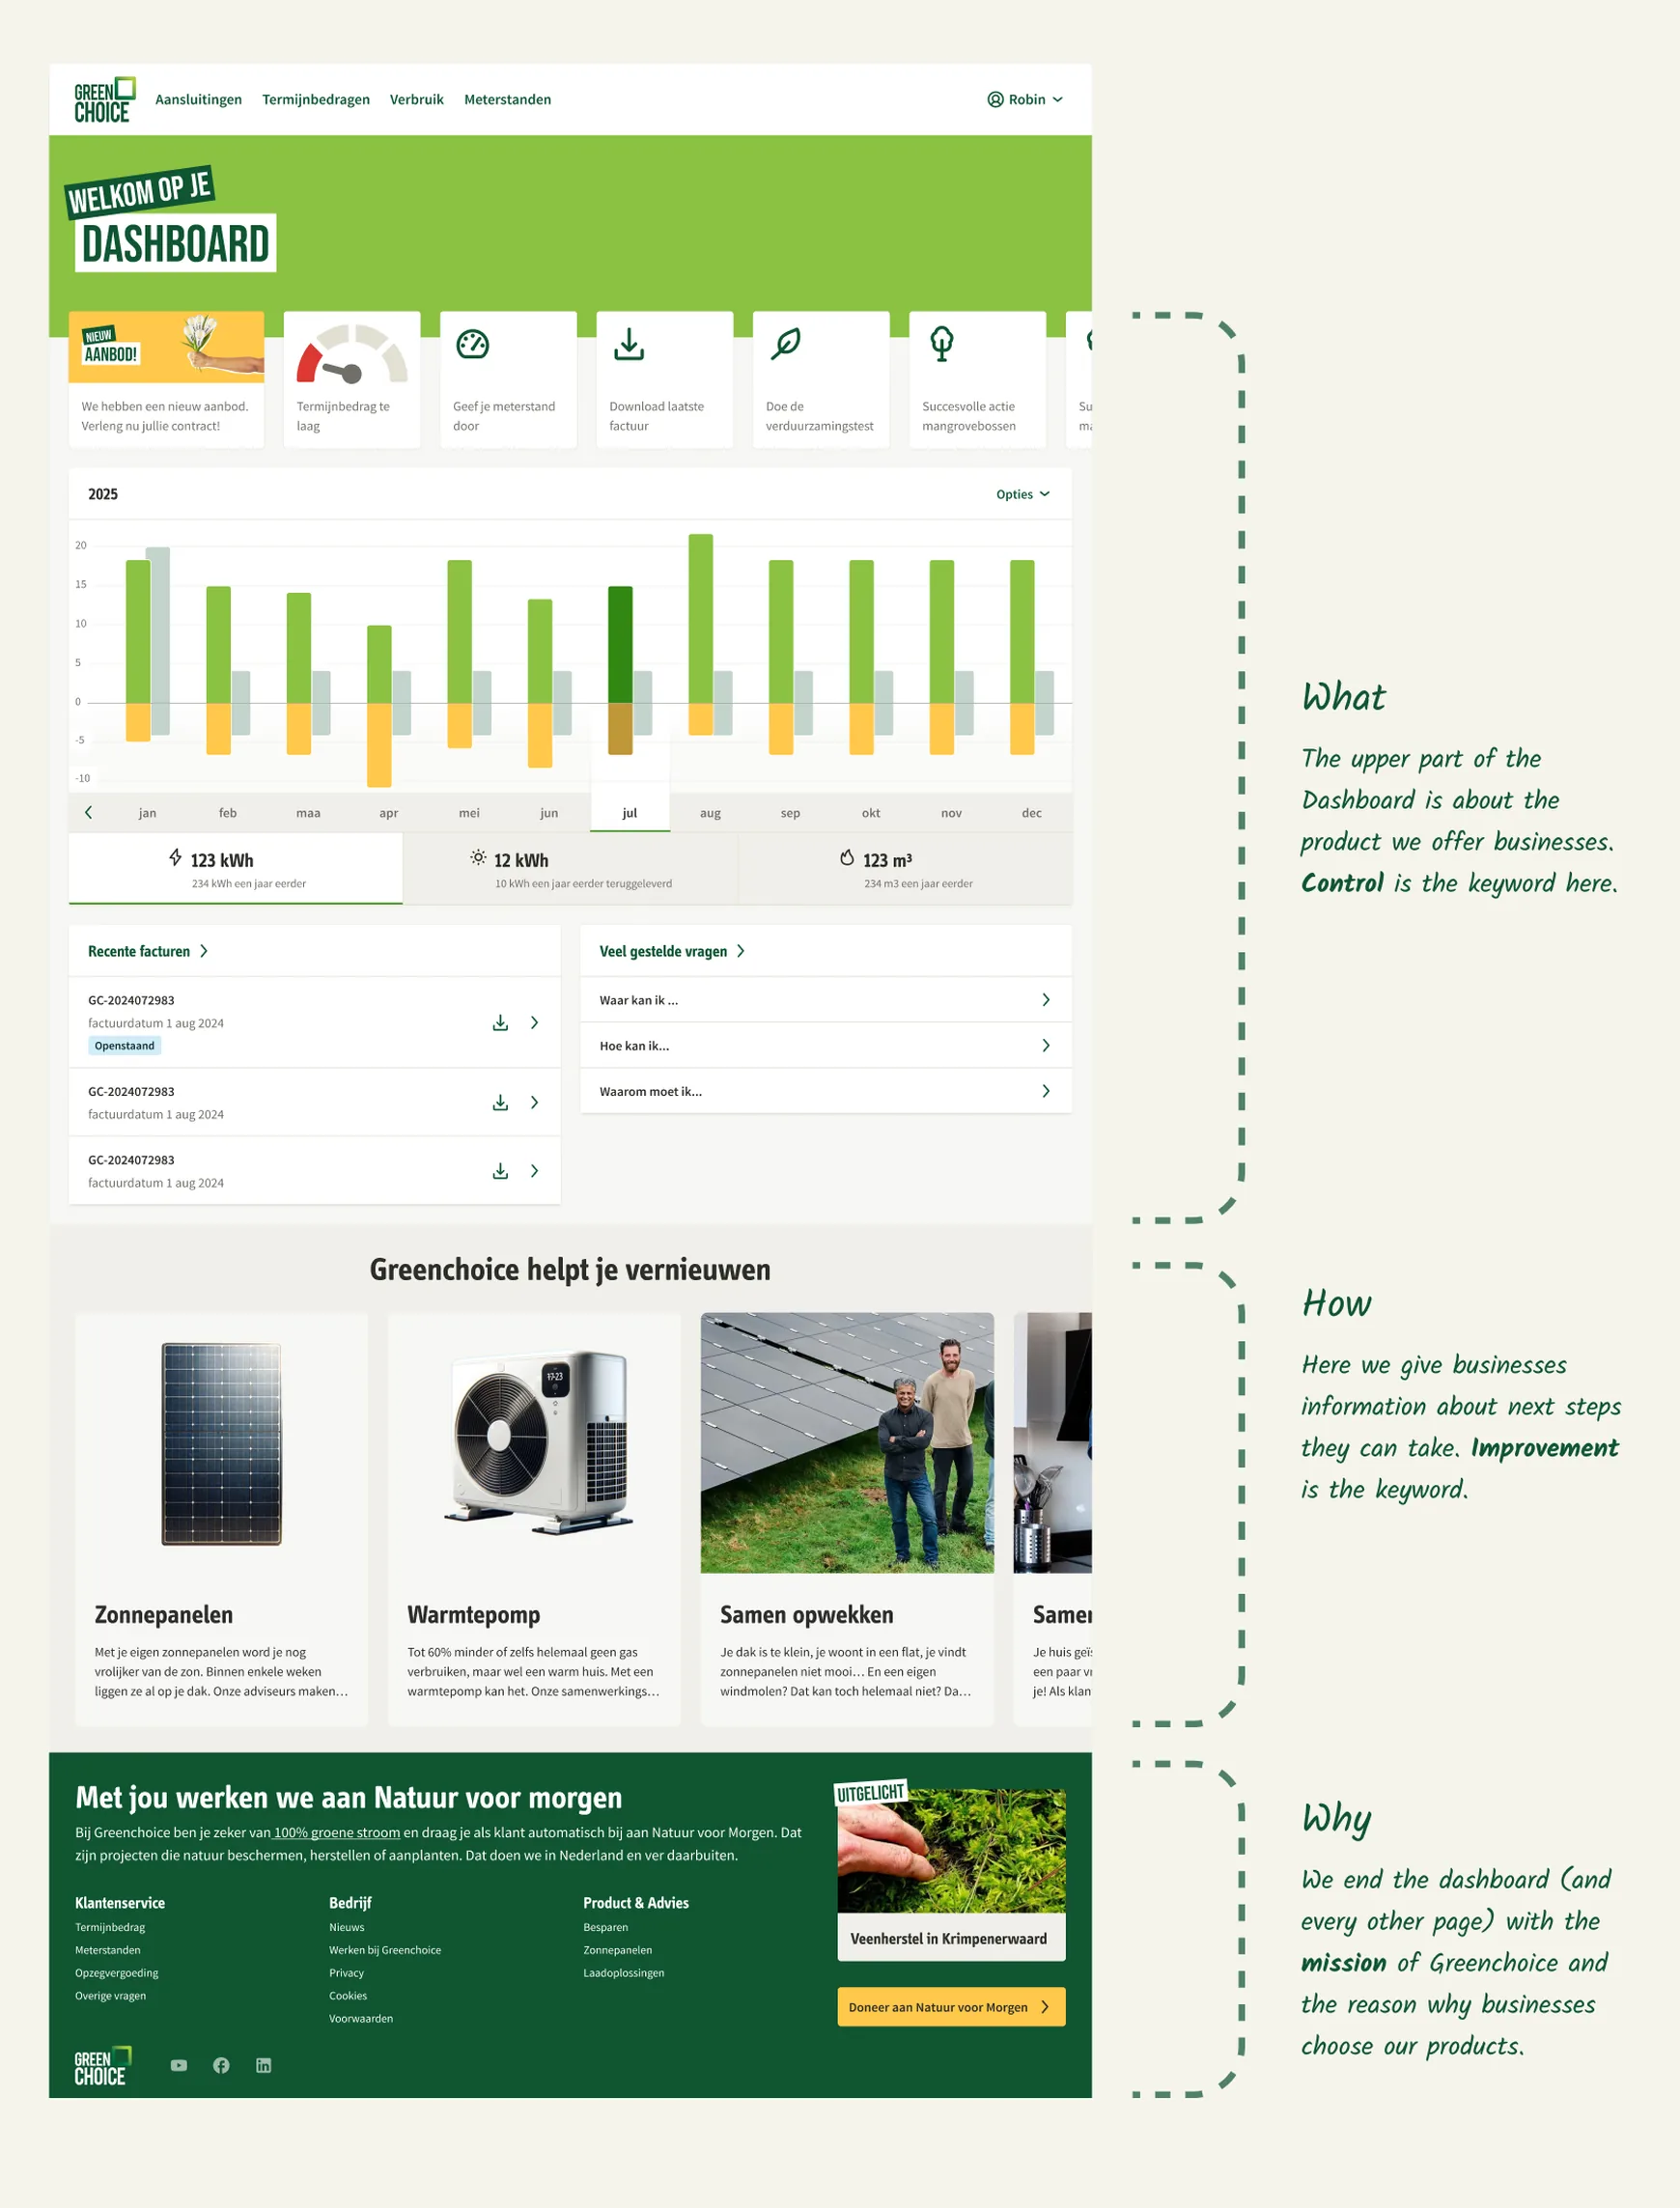
I built the dashboard, everyone’s starting point, on Simon Sinek’s Golden Circle, with each layer a bridge to the next. The what is insight into their energy usage. Once people have that insight, they might want to improve something too. That’s the how, with next steps that fit their situation. And the why is the reason to be a Greenchoice customer at all: a supplier that sets up and supports nature projects.
From baker to bakery chain
The rest of the portal builds on that dashboard. For every part, I asked: who needs this, and at what stage of their business?
A baker with one building has enough with the dashboard. A company with a few locations wants to see at a glance how each one is doing. And an organisation with hundreds of connections needs filters and management tools to keep track. In the concept, the portal recognises this from the number of connections. A baker who opens a second shop doesn’t have to learn a different product: the portal grows with the business. A kind of progressive disclosure, but tied to the size of the customer.
A plan to build on
To turn ideas into plans the organisation could carry, I worked from spring 2024 with a strategic project manager. Together we took the strategy and the roadmap, cut into separate iterations, further into the organisation. The first changes were already made during my assignment, and after the handover in December 2024 the project manager took it forward.
Business customers are people too
In B2B, a customer quickly becomes an account, a contract or a row of EANs. But the person logging in is a baker who switches on the ovens at six in the morning, a freelancer checking their invoices between two jobs, or someone at a municipality who’s responsible for the street lights. They want what everyone wants at home: to understand where they stand, without first having to learn their energy supplier’s system. Start there, and let the complexity grow with them.